| EPT · Stocks & ETFs |
| Mon Nov 9 · 6 tables and 4 charts from the close |
| Views from the terminal at the Mon Nov 9 close. The live versions update in the terminal through the session; tap any chart to open it. |
| Stocks & ETFs |
| ENTRY POINT TRADING Stocks & ETFs at the close |
| Indices | Ticker | Close | 1D | Daily count | RSI | vs 200d |
|---|
| SPY S&P 500 | $752.69 | +2.4% | Decline 7/9 | 46 | +3.0% | | QQQ Nasdaq 100 | $678.68 | +3.4% | Decline 7/9 | 41 | -0.4% | | IWM Russell 2000 | $282.51 | +3.2% | Rally 1/9 | 54 | +1.2% | | TLT 20+ year Treasuries | $81.96 | 0.0% | Rally 8/9 | 61 | -2.9% | | USO Crude oil | $142.66 | -3.9% | Decline 6/9 | 38 | +12.9% |
Mag 7 | Ticker | Close | 1D | Daily count | RSI | vs 200d |
|---|
| AAPL Apple | $350.69 | +2.4% | Rally 10/13 weekly Rally 9/9 | 58 | +17.2% | | MSFT Microsoft | $545.18 | +2.7% | Rally 4/9 | 58 | +23.8% | | NVDA Nvidia | $178.67 | -4.3% | Decline 7/9 | 27 | -12.7% | | AMZN Amazon | $266.93 | +2.9% | Rally 13/13 deferred (13+) | 59 | +9.4% | | GOOGL Alphabet | $288.15 | +1.2% | Rally 4/9 | 33 | -15.1% | | META Meta | $641.37 | +5.1% | Decline 4/13 | 46 | +1.5% | | TSLA Tesla | $378.05 | +5.5% | Decline 6/9 | 50 | -1.4% |
Most interesting across the board | Ticker | Close | 1D | Daily count | RSI | vs 200d |
|---|
| CLX Clorox | $105.53 | +5.6% | Rally 8/9 | 79 | +6.2% | | FFIV F5 Inc | $317.75 | +2.2% | Decline 9/9 weekly Rally 11/13 | 25 | -12.9% | | AIZ Assurant Inc | $317.21 | +3.3% | Rally 8/9 weekly Rally 11/13 | 78 | +23.6% | | DD DuPont de Nemours | $155.14 | +5.9% | Rally 9/9 run at 15 | 72 | +11.6% | | FER Ferrovial | $61.39 | +4.6% | Rally 9/9 run at 14 | 74 | -4.1% | | BEN Franklin Resources | $35.87 | +6.3% | Rally 9/9 | 68 | +17.7% | | MRNA Moderna | $269.00 | +5.8% | Rally 9/9 weekly Rally 9/9 | 67 | +190.6% | | NOW ServiceNow | $102.76 | +0.8% | Decline 9/9 | 29 | -10.1% |
Ranked across the S&P 500, Nasdaq 100 and the terminal's ETFs: daily count 7+, RSI past 30/70, the day's move. Names in the other tables are left out. Technical Alignment, strongest first | Ticker | Alignment | Short | Medium | Long |
|---|
| AIZ Assurant Inc | +68 | 75 | 89 | 86 | | MSI Motorola Solutions | +68 | 78 | 87 | 86 | | SWK Stanley Black & Decker | +68 | 76 | 87 | 86 | | VTRS Viatris | +68 | 75 | 88 | 86 | | BDX Becton Dickinson | +66 | 76 | 88 | 83 | | DGX Quest Diagnostics | +66 | 78 | 86 | 83 | | EW Edwards Lifesciences | +66 | 78 | 87 | 81 | | VLTO Veralto Corporation | +66 | 77 | 89 | 77 |
Technical Alignment measures how many independent indicators agree, from -100 to +100; 0 = no agreement. Short, Medium and Long are its three timeframes on a 0-100 scale, 50 = neutral. Ranked by strength across the S&P 500, Nasdaq 100 and the terminal's ETFs. Not a forecast or a recommendation. The indices: S&P 500 (SPY) +24 · Nasdaq 100 (QQQ) -6 · Russell 2000 (IWM) -20. Sectors, best to worst on the day | Ticker | Close | 1D | Daily count | RSI | vs 200d |
|---|
| XLI Industrials | $168.89 | +3.8% | Decline 4/9 | 51 | -2.6% | | XLK Technology | $170.88 | +3.7% | Decline 7/9 | 38 | +0.3% | | XLY Discretionary | $121.01 | +2.9% | Rally 1/9 | 63 | +4.8% | | XLC Communication | $107.36 | +2.5% | Rally 4/9 weekly Decline 9/9 | 52 | -4.6% | | XLV Health care | $188.33 | +1.9% | Rally 8/9 | 68 | +18.0% | | XLB Materials | $52.94 | +1.9% | Rally 5/13 | 58 | +3.4% | | XLU Utilities | $43.79 | +1.5% | Rally 10/13 | 64 | -1.2% | | XLRE Real estate | $44.64 | +1.5% | Rally 8/9 | 64 | +2.8% | | XLF Financials | $57.99 | +1.5% | Rally 8/13 | 60 | +7.7% | | XLP Staples | $90.89 | +0.9% | Rally 8/13 | 62 | +7.3% | | XLE Energy | $61.94 | +0.5% | Decline 6/9 | 36 | +4.6% |
Cross-asset | Ticker | Close | 1D | Daily count | RSI | vs 200d |
|---|
| GLD Gold | $379.53 | +1.9% | Rally 4/9 weekly Decline 9/9 | 53 | -7.6% | | SLV Silver | $48.14 | +2.7% | Rally 3/9 weekly Decline 9/9 | 43 | -23.7% | | UUP US dollar | $28.97 | -0.5% | Rally 8/13 weekly Rally 9/9 | 52 | +3.5% | | HYG High-yield bonds | $77.51 | +0.4% | Decline 5/13 weekly Decline 12/13 | 52 | -2.4% | | VIXY VIX futures | $18.21 | -13.4% | Rally 3/9 | 52 | -22.5% | | EEM Emerging markets | $61.03 | +2.9% | Decline 7/9 weekly Decline 7/9 | 42 | -4.6% |
Close of 2026-11-09. Rally 8/9 = 8 closes in a row above the close 4 bars earlier; 9 completes it. RSI 14-day. vs 200d = distance from the 200-day average. | | Source: a licensed institutional market-data feed | Analysis by Entry Point Trading | Data as of 2026-11-09 |
Open the dashboard below: every S&P 500 and Nasdaq 100 name has these columns in the terminal, live. |
| Charts from the close |
Nasdaq 100 ETF (QQQ) Below the 200-day 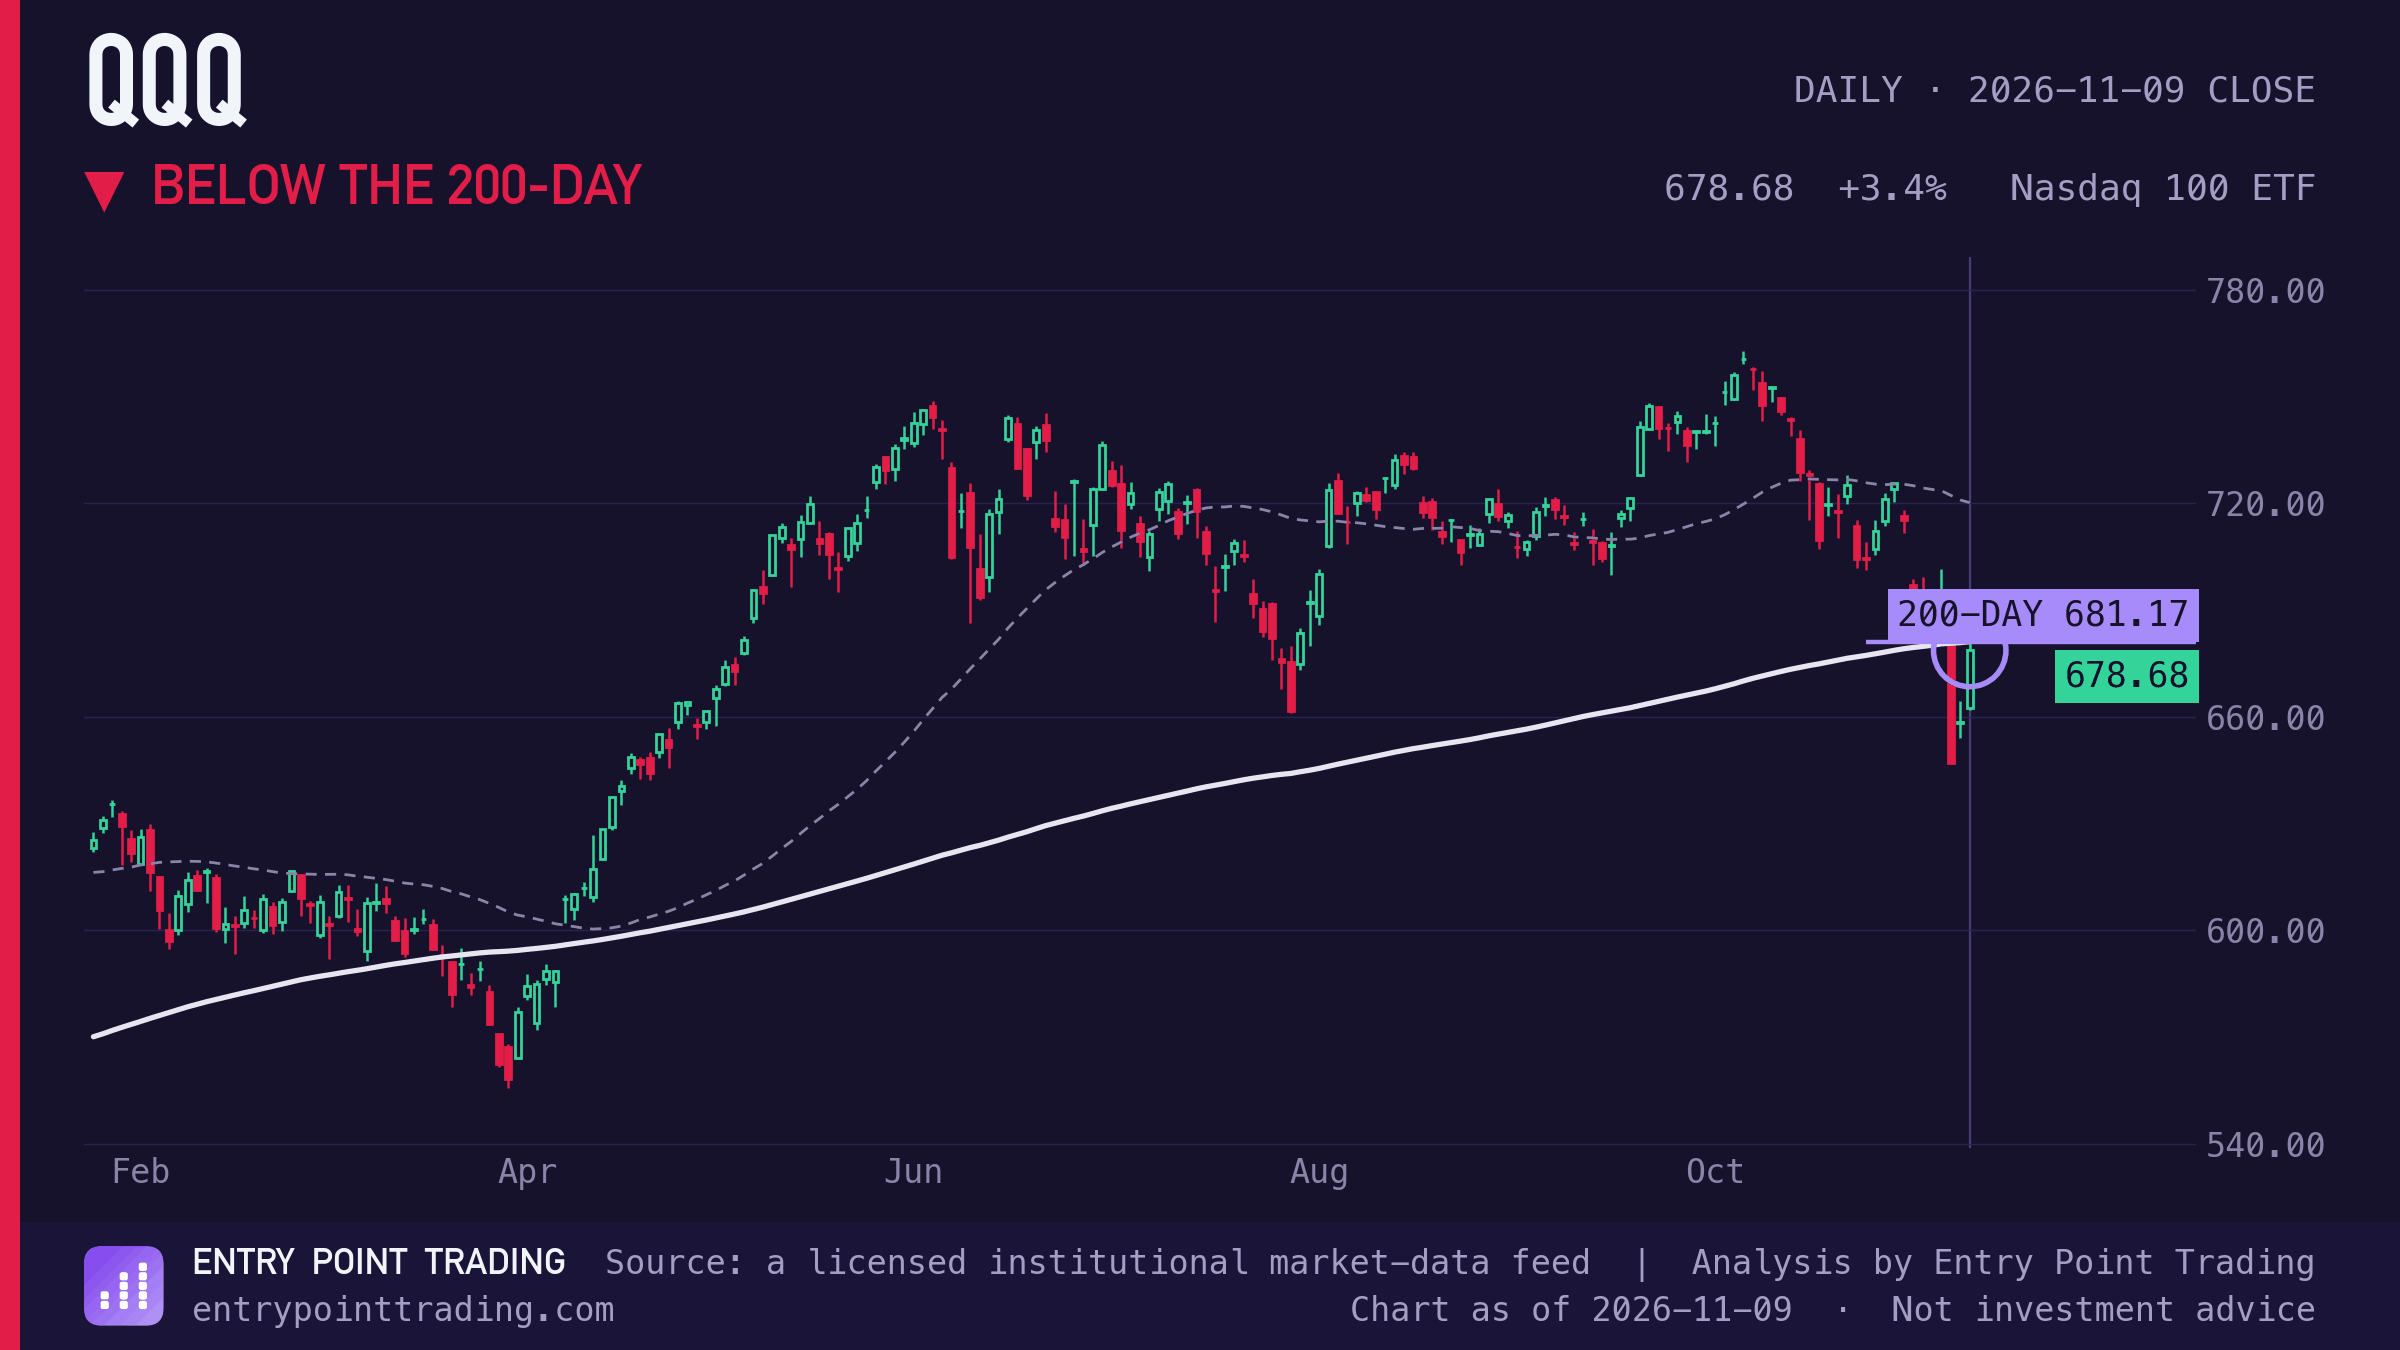 Nasdaq 100 ETF closed 2026-11-09 at $679, 0.4% below its 200-day average ($681, the white line). Open in the terminal → |
NVIDIA (NVDA) Volume surge 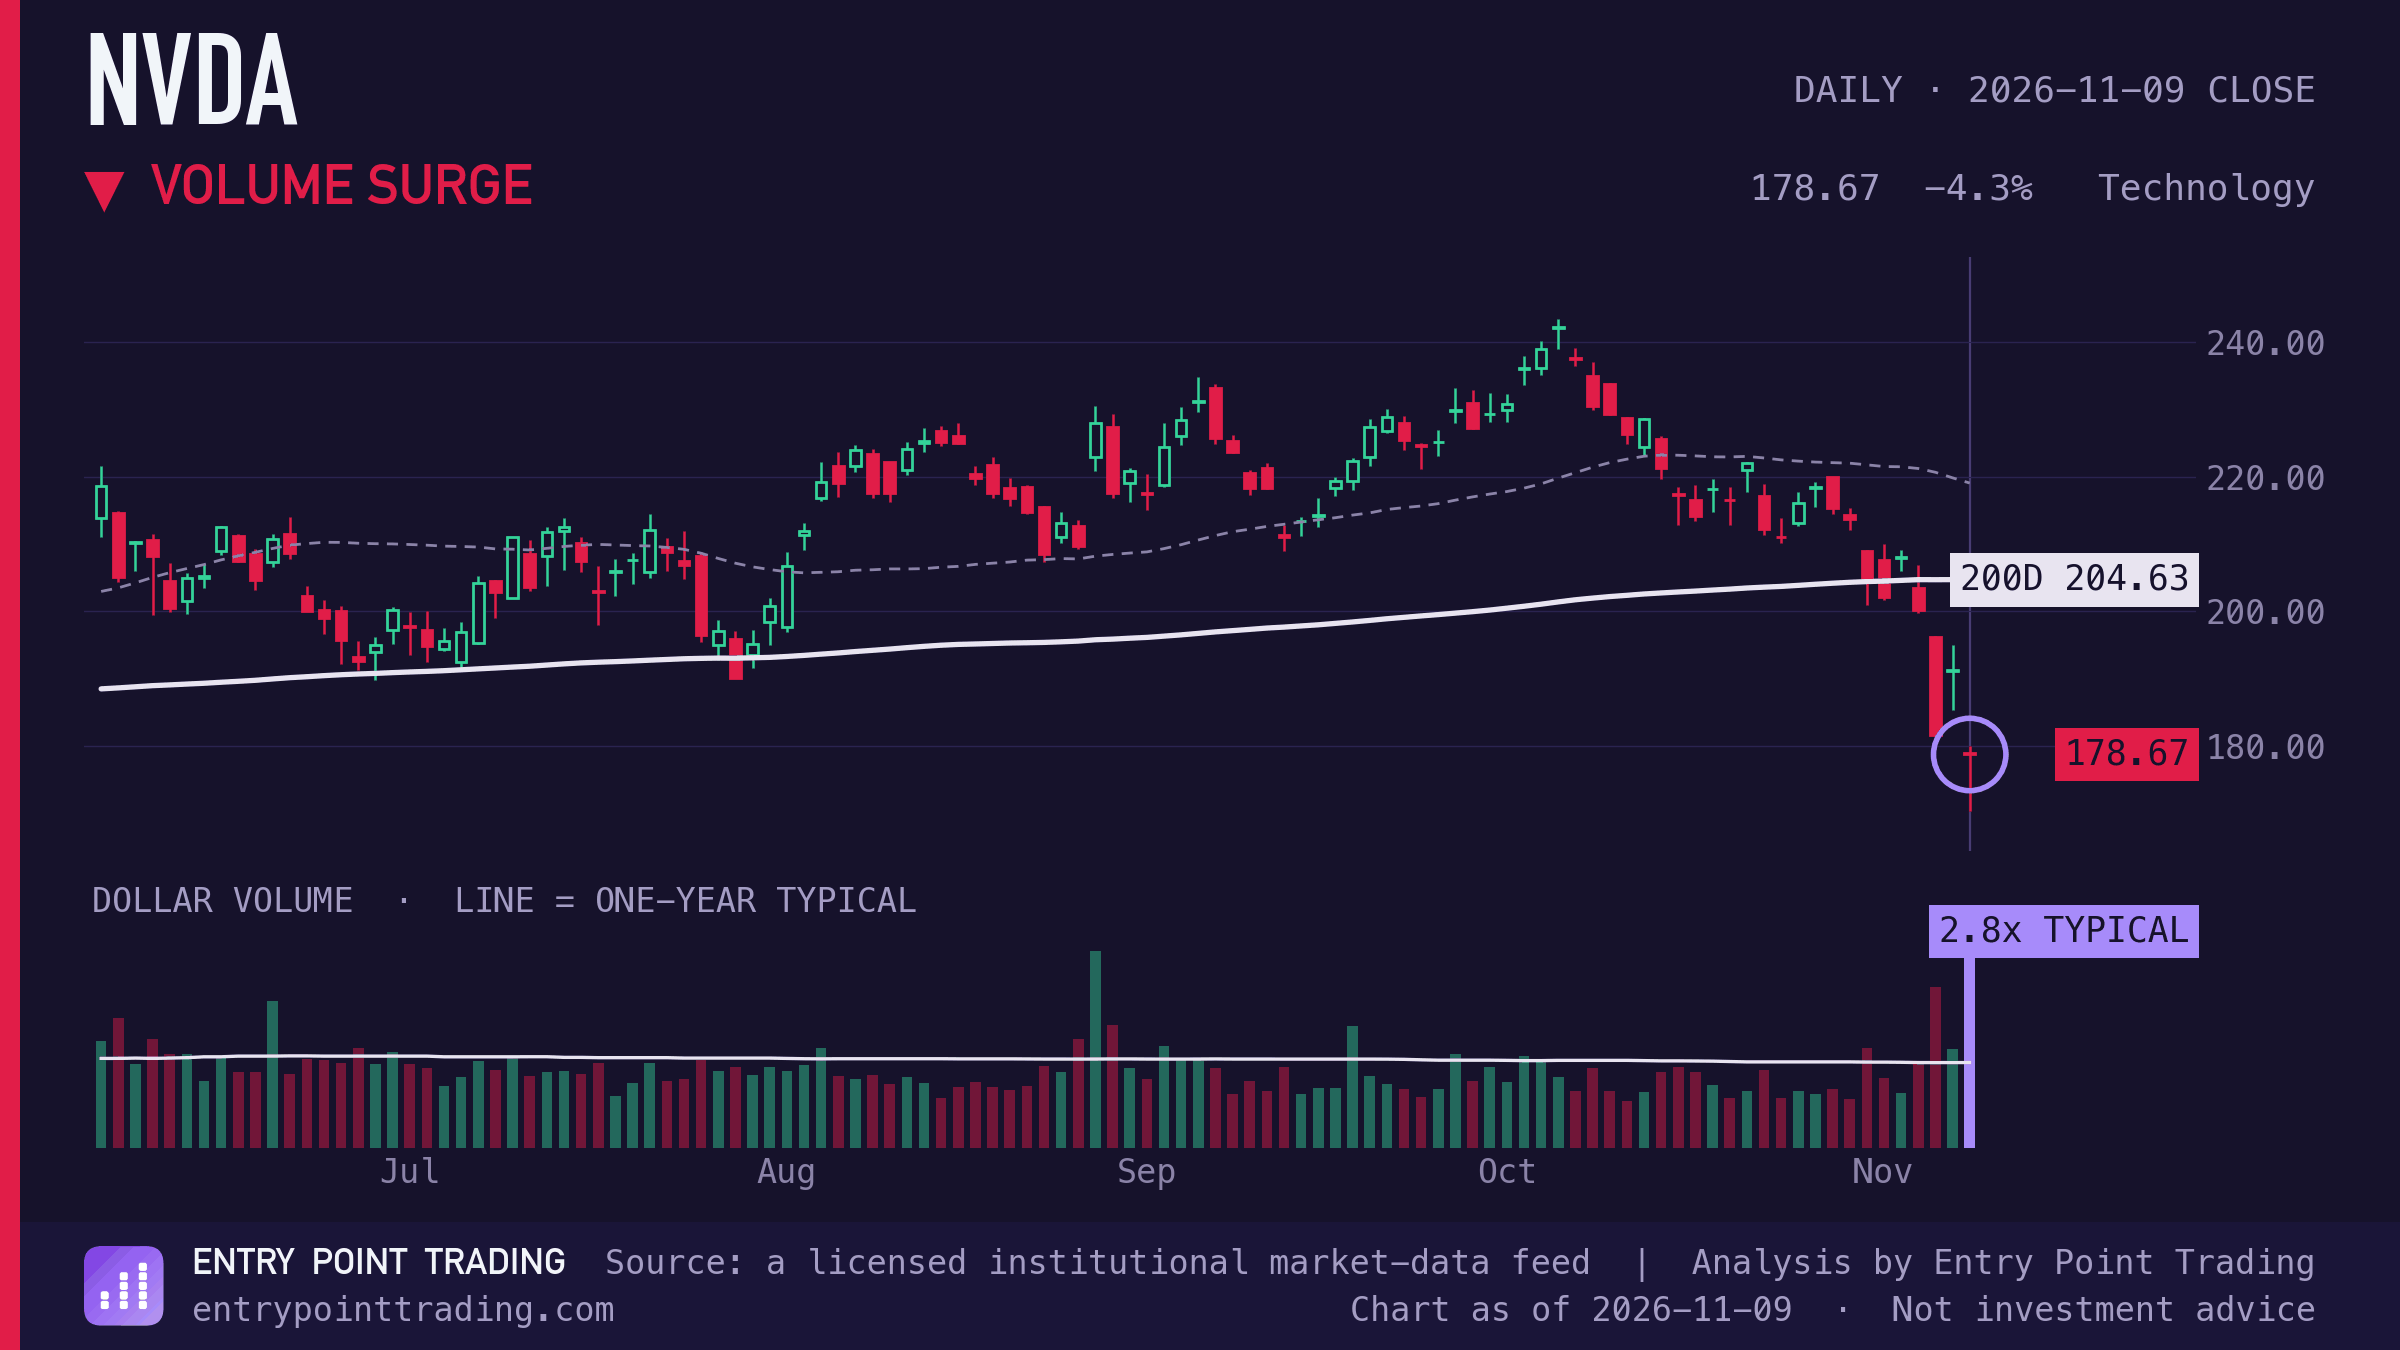 NVIDIA traded 2.8x its typical dollar volume on a -4.3% move. One session, measured against this chart's own usual move. It describes the day, not the next one. Open in the terminal → |
Ferguson Enterprises (FERG) Outsized session 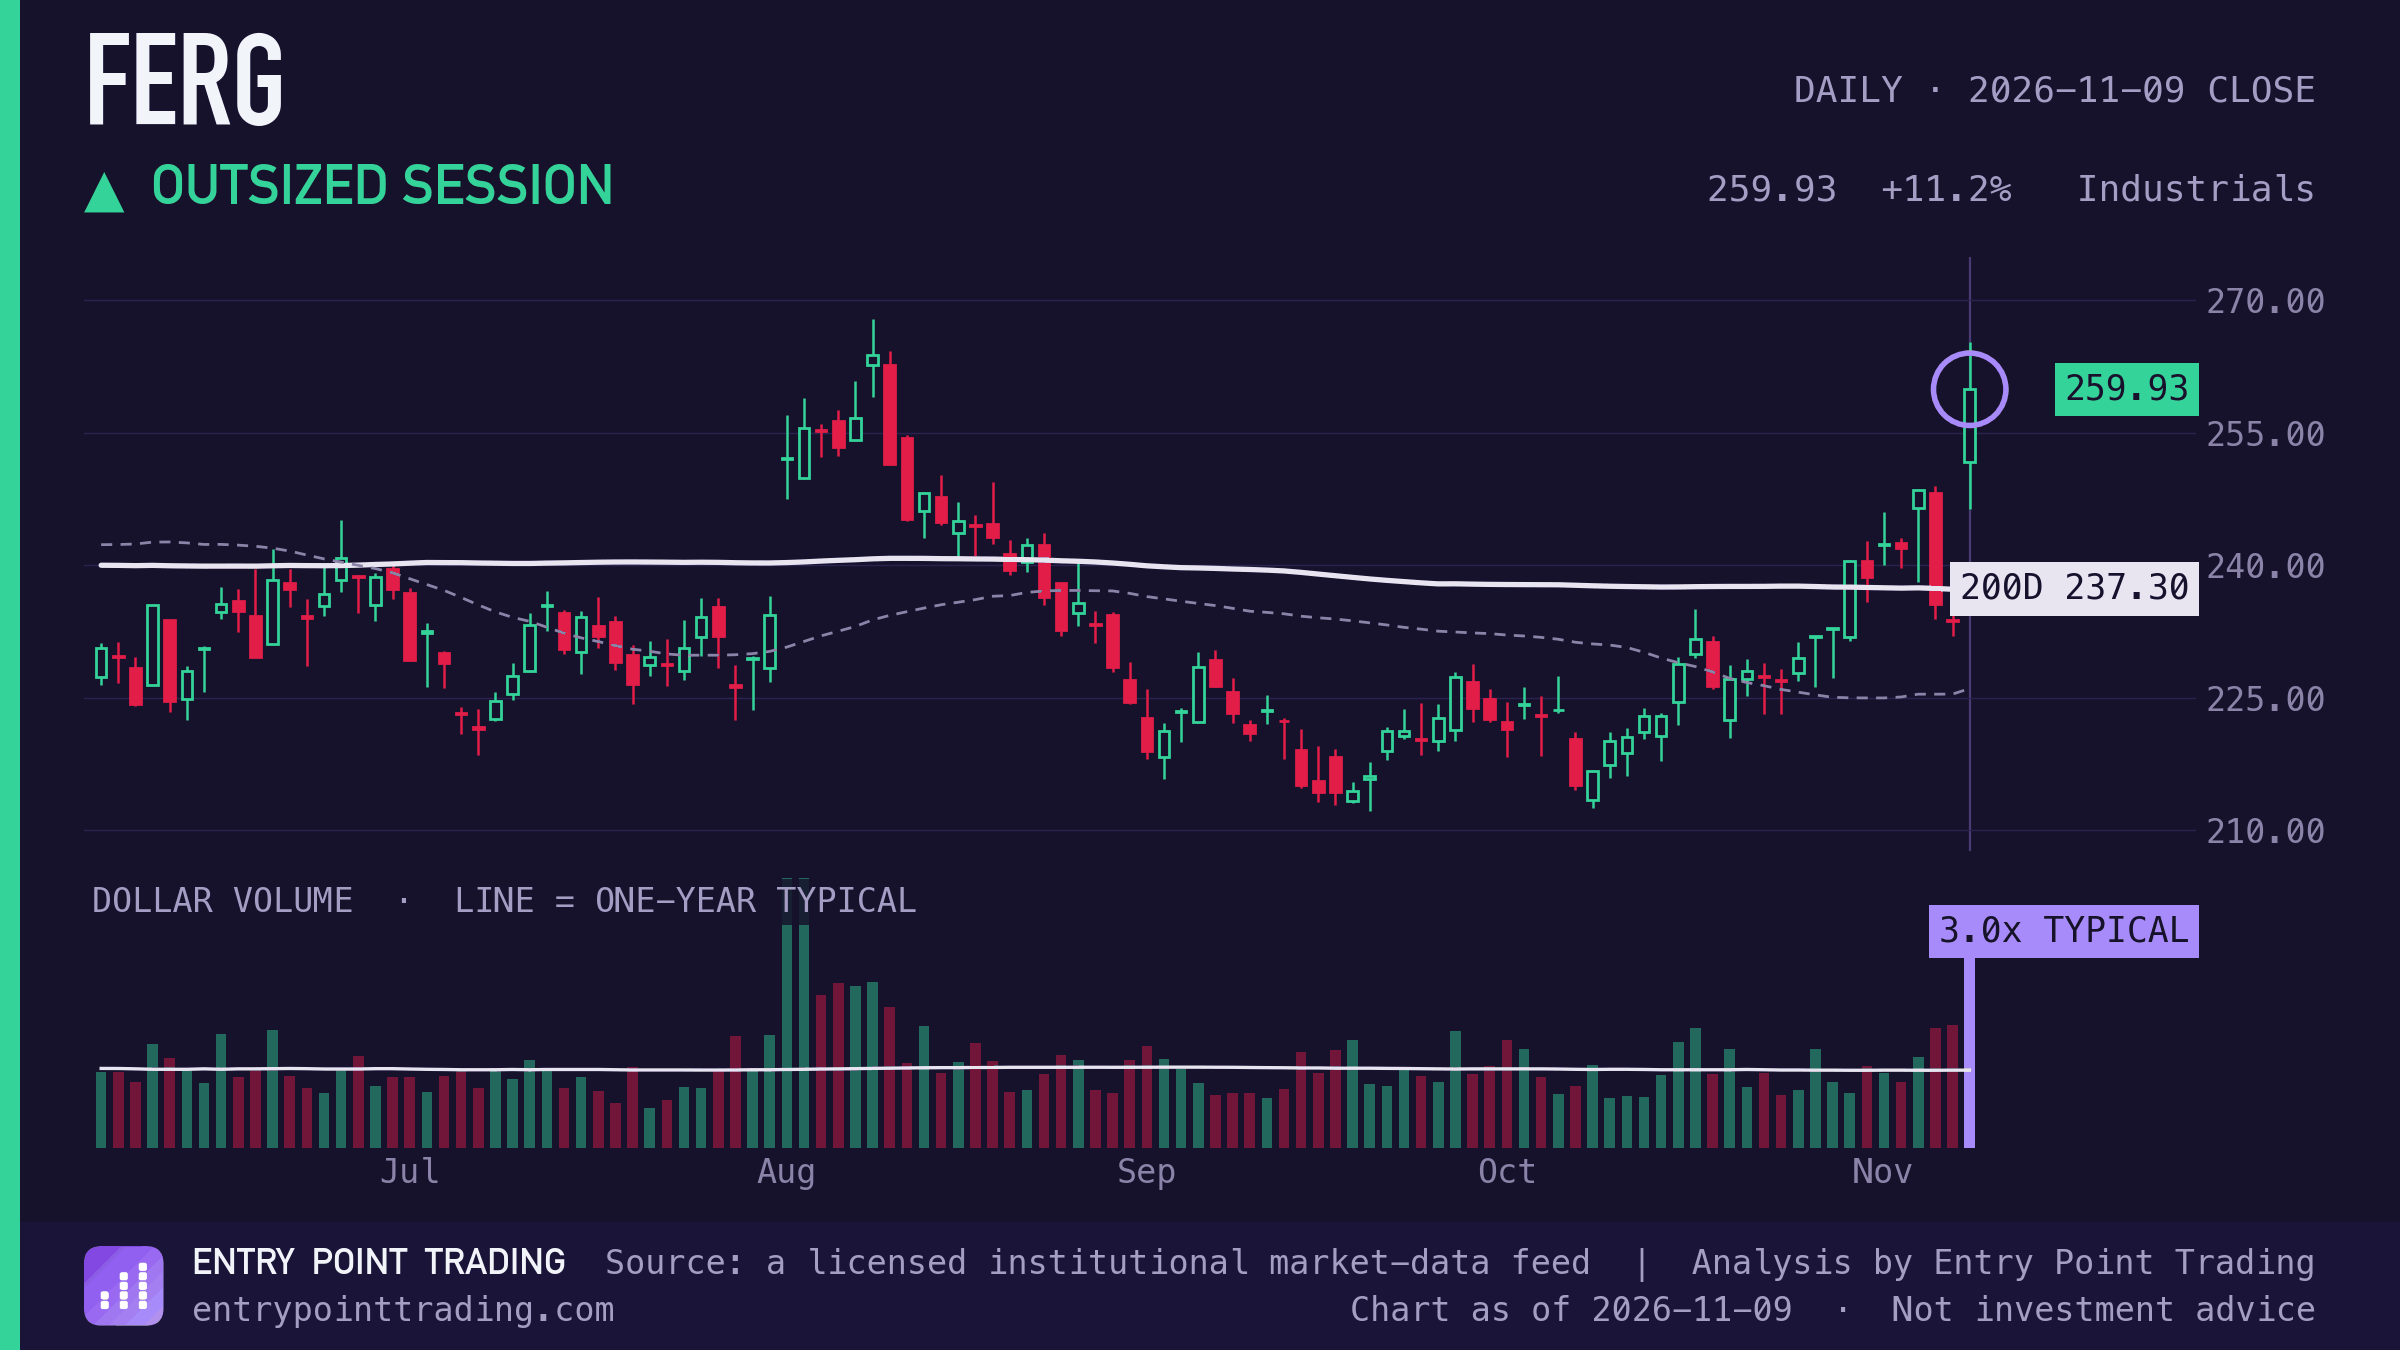 Ferguson Enterprises moved +11.2% in one session, 6.5 times its usual daily move. One session, measured against this chart's own usual move. It describes the day, not the next one. Open in the terminal → |
Tractor Supply (TSCO) Range breakout 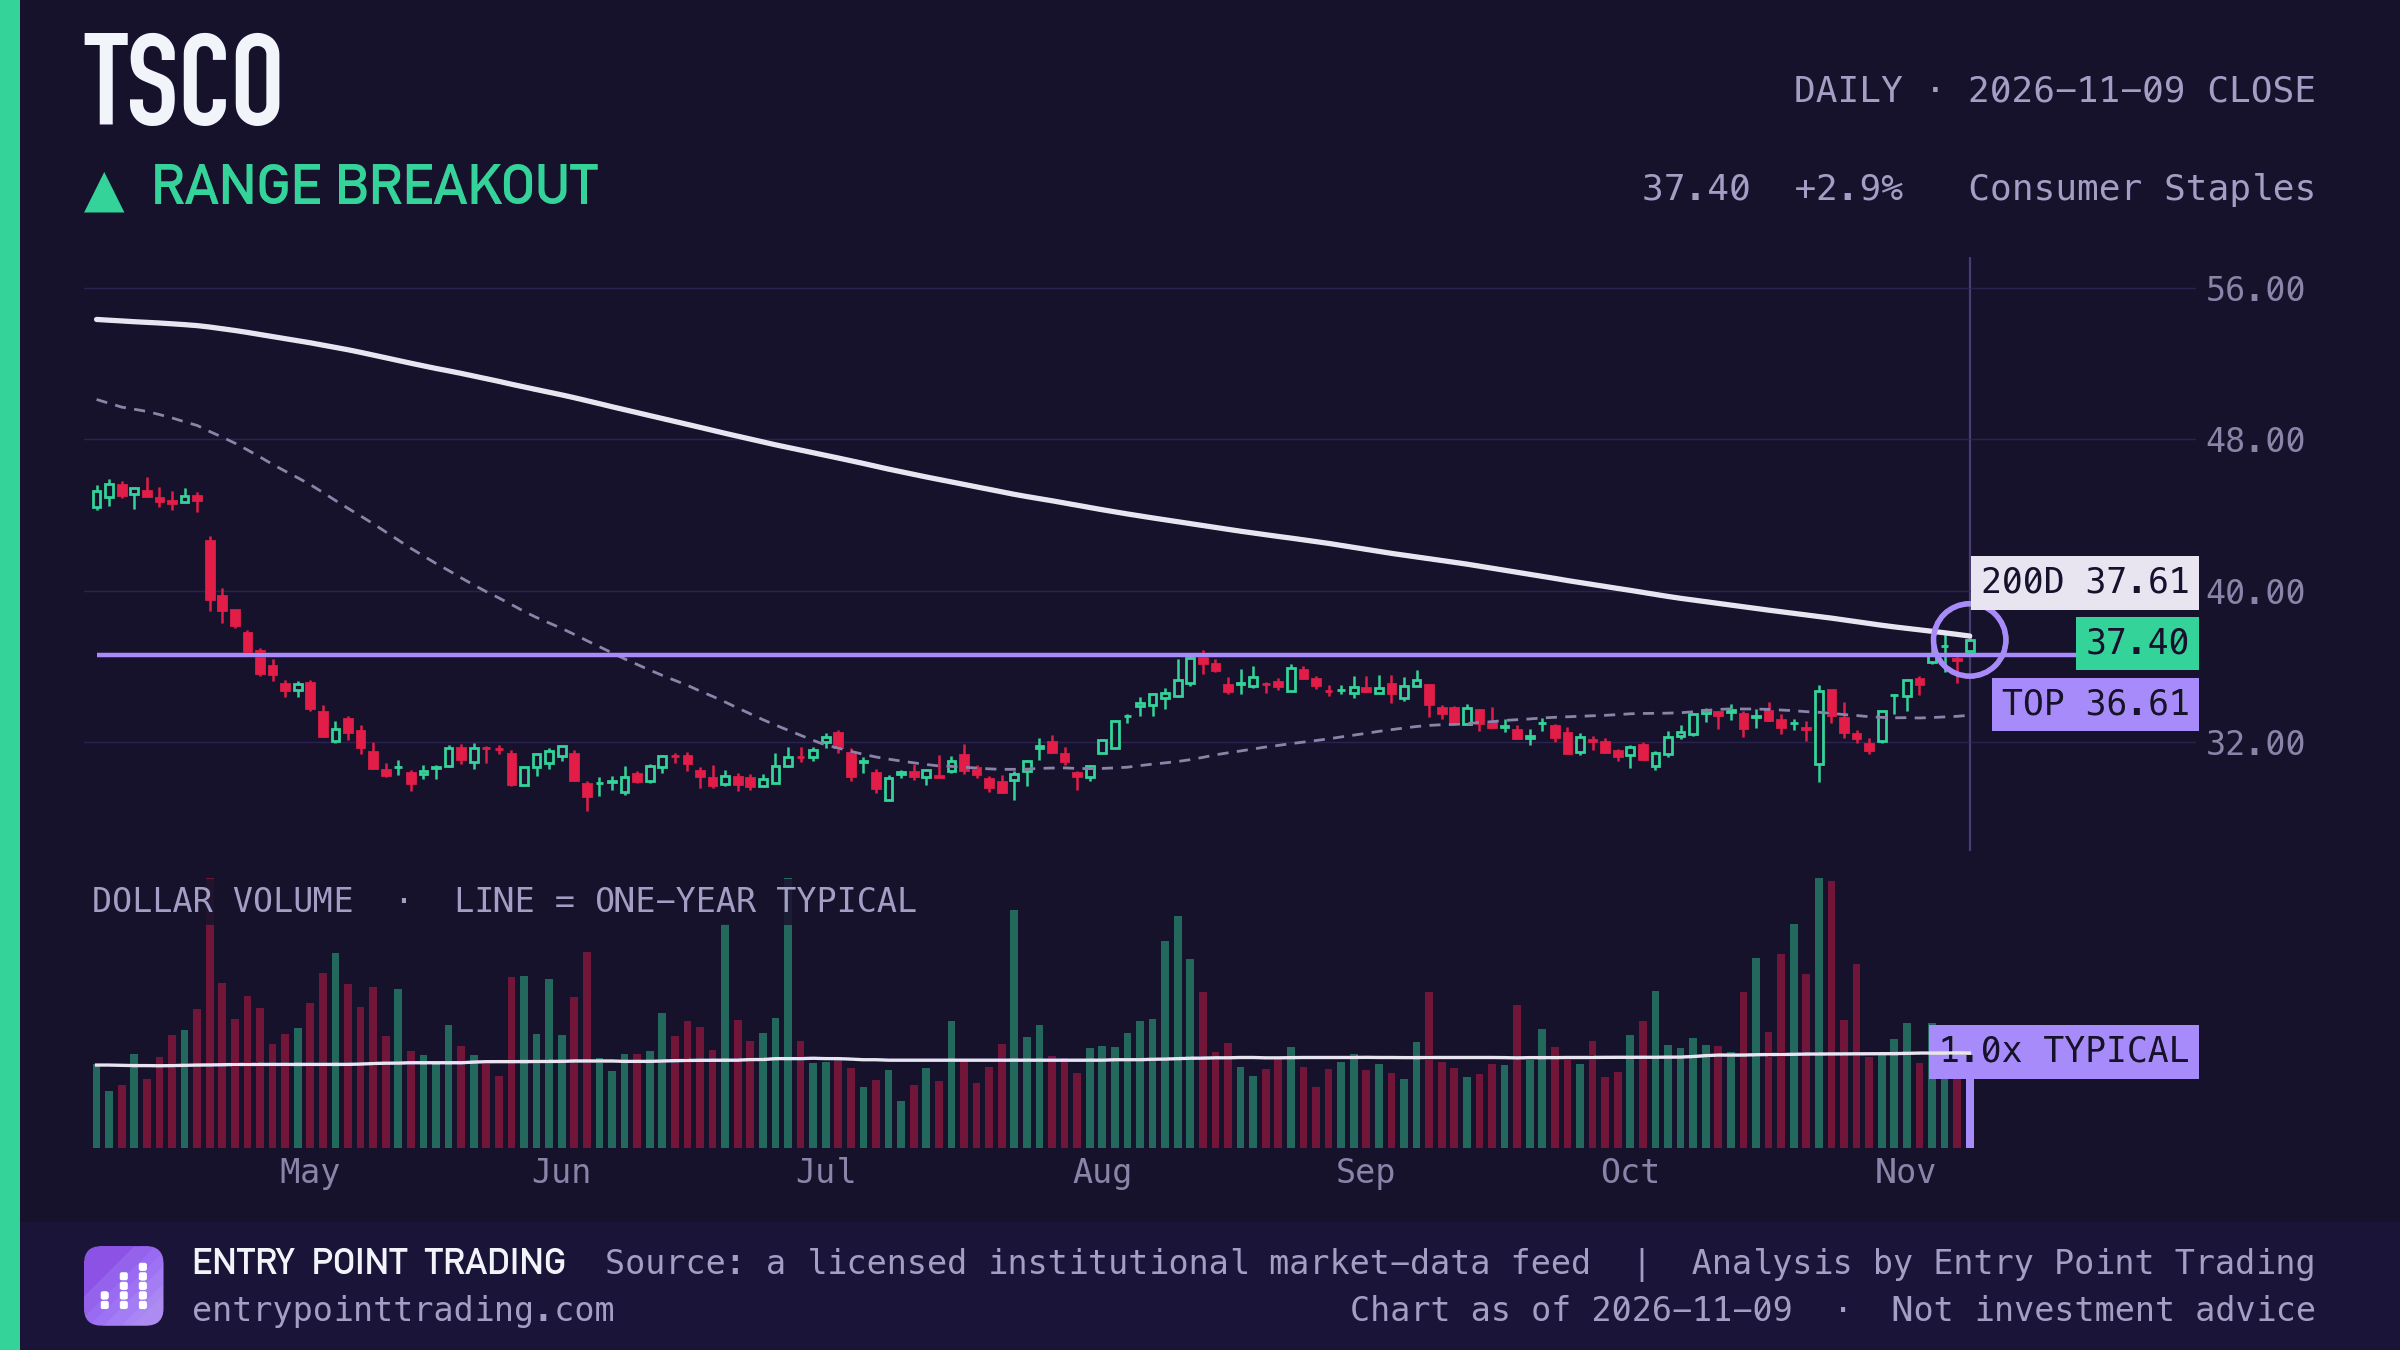 Tractor Supply closed above a 60-session range (17.8% tall, top tested 5 times). The range top is $36.61. A close back inside the range undoes the break. Open in the terminal → |
| Open the dashboard |
| Free during launch. Paid tiers come later, and early readers get founding pricing. |
Charts describe what price did. They are not advice and not a forecast.
ECWE VENTURES LLC · 202 N Cedar Ave, STE #1, Owatonna, MN 55060 |